Analyse publicitaire 101 : toutes les bases à connaître

Votre patron vous a demandé d'élaborer un plan d'action pour la campagne publicitaire du prochain trimestre.
Il y a juste un problème.
Vous êtes novice en la matière et ne savez pas par où commencer. Quels sont les indicateurs à suivre ? À quelle fréquence devez-vous les contrôler ? Et la question que vous êtes le plus gêné de poser : Que cherchez-vous ?
Aujourd'hui, nous répondons à ces questions.
Mais avant de commencer, rappelons ce qu'implique l'analyse de la publicité.
- Qu'est-ce que l'analyse des publicités ?
- Pourquoi l'analyse de la publicité est-elle importante ?
- Succès publicitaire : Les 5 meilleurs KPI et indicateurs pour mesurer l'impact de la publicité
- Pourquoi les agences de marketing suivent-elles les performances des publicités sur DashThis ?
- Comment créer un rapport sur la publicité
- Automatisez vos rapports publicitaires dès aujourd'hui
Attention : Ce guide traite de la publicité numérique et non des stratégies publicitaires traditionnelles telles que la radiodiffusion, les panneaux d'affichage et la publicité imprimée.
Qu'est-ce que l'analyse des publicités ?
L'analyse des annonces évalue la performance de vos annonces payantes afin d'atteindre vos objectifs de notoriété ou de conversion lors des prochaines campagnes.
Ce processus implique l'analyse de paramètres couvrant l'ensemble de vos activités :
(a) Canaux - "Quels canaux peuvent nous aider à atteindre notre public cible (sensibilisation) ou à attirer des clients à fort potentiel (conversions) ?" "Quel est le meilleur moyen de recibler les visiteurs d'un site abandonné ?
(b) Créatifs publicitaires - "Quelles sont les publicités qui incitent les utilisateurs à cliquer ?" "Quelle optimisation ou amélioration devrions-nous apporter au texte, au visuel ou à l'appel à l'action (CTA) pour garder notre publicité fraîche ?"
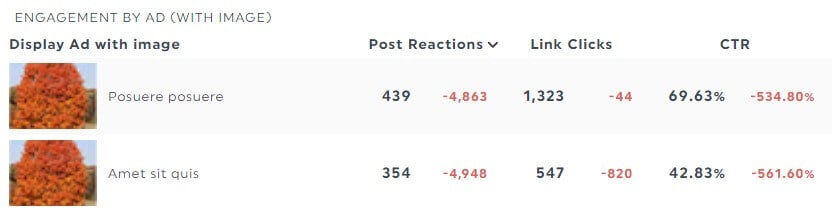
[Données via DashThis] Rassemblez automatiquement vos créations publicitaires de toutes les campagnes dans un seul rapport afin d'identifier rapidement les plus performantes.
(c) Placements - "Où nos publicités sont-elles diffusées ?" "Quels sont les emplacements qui génèrent le plus grand pourcentage de clics ou de spectateurs ? "Quelles extensions d'annonces (par exemple, le numéro de téléphone dans l'extension d'appel) génèrent des clics ?
(d) Le public - "Quel est notre segment de clientèle le plus rentable ? "Quels sont nos segments mal desservis ? "Dépensons-nous trop d'argent pour acquérir de nouveaux clients ?"
(e) Messagerie - "Quels sont les messages qui trouvent un écho auprès de notre public ?" "Quels sont les points douloureux ou les offres qui les attirent ? "Nos concurrents utilisent un langage similaire-comment pouvons-nous nous démarquer ?"
Suivi de vos KPI PPC et des mesures sur ces éléments (et en vous posant ces questions*), vous améliorerez votre compréhension du comportement des utilisateurs, créerez une publicité efficace et accélérerez la prise de décision pour les campagnes futures.
*Il s'agit de questions d'orientation. Considérez-les comme un point de départ !
Pourquoi l'analyse de la publicité est-elle importante ?
Voici les raisons d'investir dans un suivi continu des annonces dans votre stratégie de marketing.
1. Optimiser les dépenses publicitaires
Vous n'êtes pas le seul à vous débattre avec l'allocation de budget. Il est difficile d'allouer un budget à différents produits dans le cadre de campagnes ayant leurs propres budgets quotidiens.
C'est là qu'intervient l'analyse publicitaire.
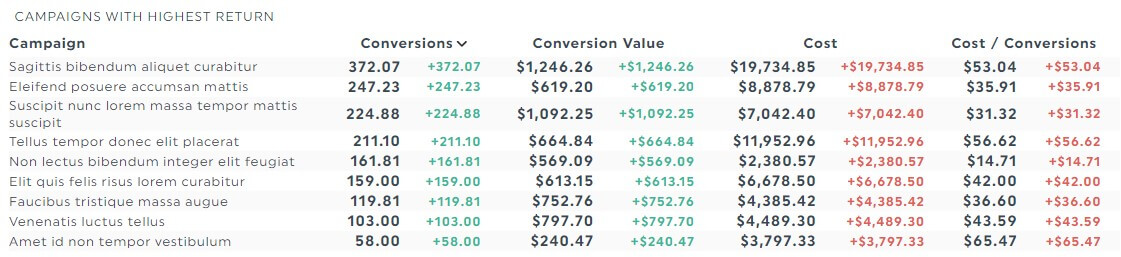
[Données via DashThis] Identifier les campagnes les plus rentables dans un format facile à comprendre
En analysant vos mesures, comme le CPA pour différents thèmes de campagne, vous savez quelles publicités attirent les clients et vous vous assurez que vos dépenses publicitaires sont rentables.
2. Améliorer la portée et l'engagement
Si vous débutez, vous vous êtes probablement rendu compte que votre ciblage publicitaire ne couvre pas entièrement le profil de votre client idéal.
Une analyse rapide de la portée de vos annonces et du taux d'engagement en fonction des données démographiques montrera quelles sont les annonces les moins performantes. Vous pouvez alors exclure les attributs non pertinents et améliorer votre stratégie de ciblage.
3. Obtenir des informations pour l'avenir
Que votre objectif soit d'accroître la notoriété ou les conversions, vous testerez probablement différents messages, créations et offres pour des segments spécifiques afin de trouver les meilleures performances.
Vous adopterez l'annonce qui fait progresser vos indicateurs comme meilleure pratique pour vos futures campagnes.
4. Identifier les personnes les plus performantes
Enfin, le fait de savoir quelles sont les publicités qui ont eu un impact significatif sur vos efforts augmente vos chances de reproduire ce succès dans d'autres campagnes de marketing numérique. campagnes de marketing numérique.
Succès publicitaire : Les 5 meilleurs KPI et indicateurs pour mesurer l'impact de la publicité
Commencez par ces KPI publicitaireset tactiques d'amélioration si vous ne savez pas par où commencer.
1. Taux de clics (CTR)
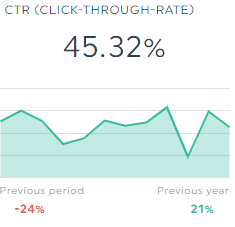
QU'EST-CE QUE C'EST :
Le taux de clics (CTR) est le pourcentage de clics qu'une annonce reçoit de la part de tous les utilisateurs qui la voient.
Le CTR idéal dépend de la plateforme publicitaire et du secteur d'activité. Par exemple, le CTR moyen de Google Ads pour les rencontres et les services personnels est de 6 %.
Mesurez le CTR quotidiennement pour voir si votre annonce est pertinente et si elle incite les utilisateurs à se rendre sur la page d'atterrissage.
POURQUOI IL EST IMPORTANT DANS L'ANALYSE PUBLICITAIRE :
Les annonces à fort CTR bénéficient d'un meilleur Quality Score > d'un meilleur classement > de clics moins chers.
UNE FAÇON DE L'AMÉLIORER :
Expérimentez des déclencheurs émotionnels.
Une clinique de gynécologie pourrait mettre en lumière le parcours émotionnel des femmes qui tentent de tomber enceintes. Conseil : réalisez des études de marché et de clientèle pour comprendre les expériences des clients potentiels.
2. Coût par clic (CPC)
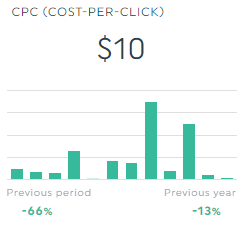
QU'EST-CE QUE C'EST :
Le coût par clic(CPC) est le prix que vous payez pour chaque utilisateur qui clique sur votre annonce.
Suivez-le quotidiennement pour éviter les dépenses excessives.
POURQUOI IL EST IMPORTANT DANS L'ANALYSE PUBLICITAIRE :
Le CPC a un impact sur votre retour sur investissement. Veillez à ce qu'il soit inférieur au bénéfice que vous tirez d'une vente.
UNE FAÇON DE L'AMÉLIORER :
Enchérir sur des mots-clés à longue traîne (pour Google et Bing Ads).
Ils ont généralement des volumes de recherche mensuels plus faibles, moins de concurrence, génèrent un trafic ciblé plus important et sont moins chers.
3. Taux de conversion (CVR)
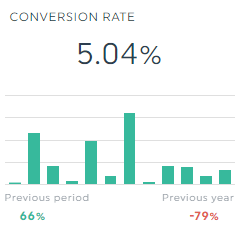
QU'EST-CE QUE C'EST :
Le pourcentage d'utilisateurs effectuant une action à forte valeur ajoutée, mesuré par rapport au nombre total de visiteurs sur une période donnée. Mesurez-le chaque semaine pour repérer les actions clés que les utilisateurs accomplissent tout au long de leur parcours.
POURQUOI IL EST IMPORTANT DANS L'ANALYSE PUBLICITAIRE :
Évaluez la rentabilité et vérifiez si votre produit (ou votre message, votre offre, etc.) trouve un écho auprès des clients.
UNE FAÇON DE L'AMÉLIORER :
Améliorer la page d'atterrissage.
Veillez à ce que le message de votre annonce corresponde au texte de votre page de renvoi afin d'éviter une expérience déconnectée. Vous pouvez également ajouter une étude de cas pour renforcer votre crédibilité.
4. Coût par acquisition (CPA)
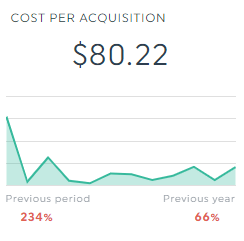
QU'EST-CE QUE C'EST :
Le coût payé pour chaque client acquis. Selon les experts, il ne doit pas augmenter de 5 % ou plus. Suivez-le mensuellement pour éviter de dépenser trop pour l'acquisition de nouveaux clients.
POURQUOI IL EST IMPORTANT DANS L'ANALYSE PUBLICITAIRE :
Votre CPA vous permet de contrôler vos dépenses publicitaires et de maximiser vos campagnes.
UNE FAÇON DE L'AMÉLIORER :
Ajustez le budget par région (uniquement les pays que vous ciblez !) pour réduire le CPA et améliorer le ROI.
Les coûts publicitaires varient d'une région à l'autre en raison de la concurrence et du pouvoir d'achat. Par exemple, le CPC seul au Japon est 47 % inférieur qu'en Amérique. Nous pensons que le CPA est également moins cher.
5. Retour sur investissement publicitaire (ROAS)
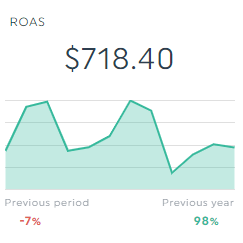
QU'EST-CE QUE C'EST :
Le retour sur investissement publicitaire(ROAS) est le revenu que vous obtenez pour chaque dollar dépensé dans vos campagnes publicitaires. En général, un faible ROAS correspond à un ratio inférieur à 2:1.
Vérifiez-le tous les mois pour évaluer l'efficacité de vos annonces à générer des revenus.
POURQUOI IL EST IMPORTANT DANS L'ANALYSE PUBLICITAIRE :
Personne ne veut épuiser son budget publicitaire ! Votre ROAS vous permet de suivre l'impact de vos campagnes publicitaires sur vos résultats.
UNE FAÇON DE L'AMÉLIORER :
Segmenter les clients afin d'améliorer le ciblage (par exemple, les annonces de réduction de bienvenue pour les nouveaux acheteurs qui ont abandonné des paniers).
Pourquoi les agences de marketing suivent-elles les performances des publicités sur DashThis ?
En tant que spécialiste des annonces, vous consacrez probablement au moins 30 minutes par semaine à l'élaboration de campagnes complètes pour chaque client.
En supposant que vous travaillez actuellement avec 15 clients, cela représente un total de 7,5 heures de travail manuel (non facturable) par semaine.
C'est beaucoup.
Ce temps est mieux utilisé pour des activités à valeur ajoutée telles que les réunions stratégiques et l'analyse des annonces.
Heureusement, c'est là que DashThis intervient.
Rassemblez automatiquement vos données sur plusieurs plateformes publicitaires, campagnes et groupes (ou ensembles) en un seul rapport magnifique. Notre outil de reporting automatisé crée des rapports depuis les publicités Instagram et TikTok jusqu'aux publicités Google et Bing en un rien de temps, ce qui vous fait gagner des heures.
Les agences qui automatisent leurs rapports sur DashThis apprécient :
(i) Intégrations natives avec des acteurs majeurs comme TikTok Ads, LinkedIn Ads, Google Ads, Instagram Ads et Facebook Ads. La création d'un rapport de publicité se fait en quelques clics.
(ii) Gestionnaire de fichiers CSV pour vos données personnalisées. Vous pouvez également utiliser notre intégration Google Sheets pour ajouter n'importe quelle mesure, provenant de n'importe quelle source, des calculs personnalisés ou des données propriétaires.
(iii) Tableau de bord tout-en-un grâce à l'intégration multicanal. Combinez vos outils d'analyse outils d'analyse publicitaire en un seul endroit. Vous pouvez également les combiner avec d'autres canaux de marketing (par exemple, e-mail, SEO, médias sociaux) dans un seul rapport.
(iv) Des indicateurs pré-remplis comme le CTR, le CVR et le CPA. Il suffit de cliquer une fois sur un indicateur pour que DashThis le transforme automatiquement en un graphique ou un diagramme attrayant.
(v) Nombre illimité de comptes, de sources de données et d'utilisateursQuel que soit votre plan, vous disposez d'un nombre illimité de comptes, de sources de données et d 'utilisateurs.
(vi) De multiples options de partage, comme l' envoi automatique de courriels. Vos données sont mises à jour quotidiennement, ce qui vous permet d'accéder aux résultats les plus récents du tableau de bord.
Ces fonctionnalités permettent de regagner du temps pour jouer un rôle plus proactif dans les portefeuilles et les campagnes publicitaires des clients.
En fait, l'un de nos clients l'un de nos clients a déclaré qu'il avait rendu le reporting "plus transparent, plus clair et plus amusant". Le format de DashThis permet d'avoir une vision holistique d'une marque et de ses efforts en ligne".
Comment créer un rapport sur la publicité
DashThis est le plus simple le plus facile à utiliser.
D'abord, faites votre essai gratuit de 15 jours dès aujourd'hui.
Ensuite, suivez les étapes suivantes pour créer un rapport sur les publicités élégantes :
- Sélectionner un modèle de rapport
- Connectez vos chaînes publicitaires préférées avec DashThis
- Choisissez vos indicateurs dans Widgets prédéfinis (conseil : tous les indicateurs sont classés par ordre de popularité. Développez votre liste d'indicateurs ici pour mieux comprendre vos campagnes publicitaires)
Attendez quelques secondes pendant que DashThis recueille automatiquement les données. Faites-les glisser et déposez-les dans un format facile à comprendre.
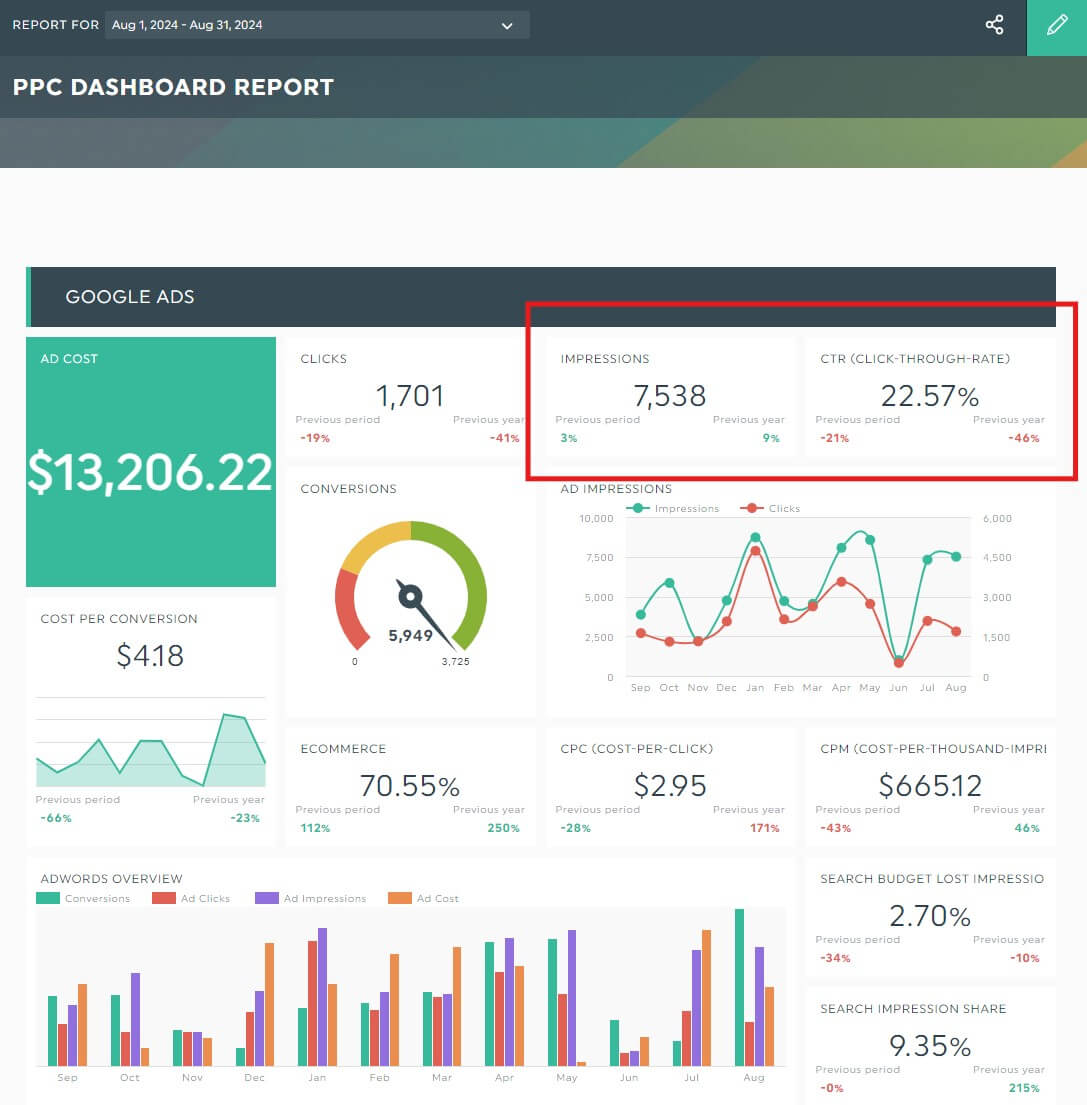
Téléchargez ce rapport PPC gratuit avec vos propres données !
L'analyse de la performance globale de votre performance globale de votre campagne dans une seule interface n'est-elle pas facile ? Par exemple, vous pouvez voir immédiatement que le CTR insuffisant et les impressions élevées (dans l'encadré rouge ci-dessus) indiquent que votre message publicitaire ou votre offre a besoin d'être retravaillé.
Personnalisez votre tableau de bord publicitaire en changeant les couleurs et le logo.
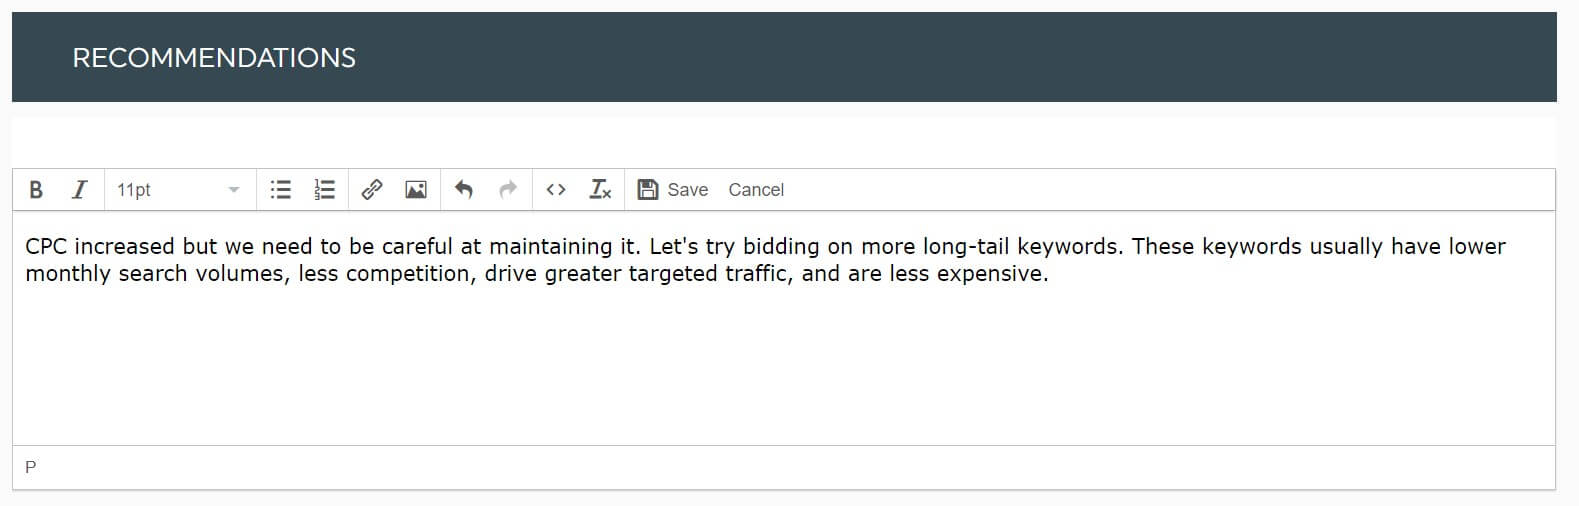
Vous pouvez ajouter votre analyse et vos recommandations directement dans le rapport (remarque : cela vous évite de rédiger un courriel distinct à l'intention des parties prenantes).
Par exemple, si vous souhaitez suggérer d'enchérir sur un plus grand nombre de mots-clés à longue traîne afin d'augmenter le trafic ciblé et de réduire les coûts, cliquez sur Widget statique > Commentaire pour défendre votre point de vue.
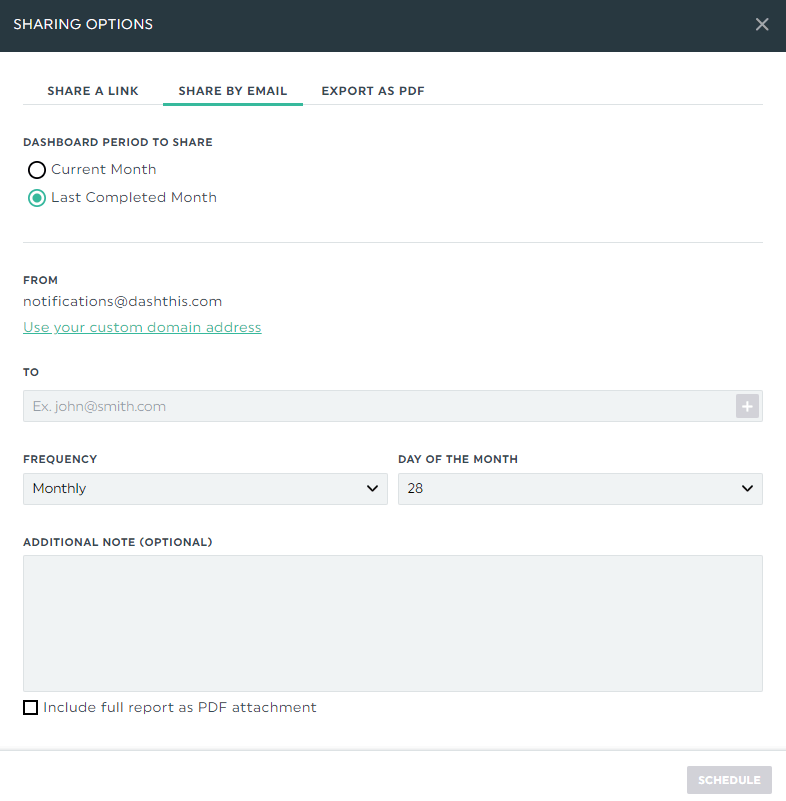
Une fois cela fait, planifiez l'envoi automatique d'un courriel à toutes les parties prenantes :
- Passez sur l'icône Options de partage en haut à droite
- Cliquez Partager par e-mail
- Définir la période et la fréquence du tableau de bord
- Ajouter une note facultative
- Cliquez Calendrier
Cet envoi par courrier électronique vous permet de recevoir votre rapport automatiquement selon le calendrier de votre choix.
Vous pouvez également partager votre rapport d'annonces par le biais d'un lien URL.
Ou imprimez-la pour la prochaine session de stratégie.
Commencez votre essai gratuit de 15 jours pour automatiser vos rapports d'annonces dès aujourd'hui.
Automatisez vos rapports publicitaires dès aujourd'hui
Ces cinq indicateurs révèlent ce qui fonctionne dans vos efforts publicitaires.
Commencez par poser les questions directrices de votre analyse publicitaire. Elles vous aideront à repérer les thèmes fructueux dans les campagnes, à comprendre le comportement des utilisateurs et à vous rapprocher de la croissance.
Mieux encore, automatisez le reporting de vos annonces sur DashThis.
Rassemblez automatiquement vos données sur plusieurs plateformes dans un seul et même rapport. Commencez votre essai gratuit de 15 jours pour créer des rapports en un clin d'œil et récupérer des heures de votre temps dès aujourd'hui.

Prêt à suivre vos indicateurs clés de performance en matière de publicité ?
Lire la suite

Ne manquez pas cette occasion !
Suivez-nous sur les médias sociaux pour rester à l'écoute !
Automatisez vos rapports !
Rassemblez toutes vos données marketing dans un seul rapport automatisé.
Essayer dashthis gratuitement